LibreOffice introduces Sparklines in its spreadsheet program Calc. Here’s how to add it.
Table of Contents
What is Sparklines?
Sparklines are small graphs which you can create inside a cell. It can be a line, stack or column graph based on a range of values.
From LibreOffice version 7.4 onwards, you can create Sparklines just like Microsoft Excel. You can also import Excel files to LibreOffice having sparklines or create XLSX files from LibreOffice.
In this article, I will discuss how easily you can create sparklines.
How to Create Sparklines – The easiest way
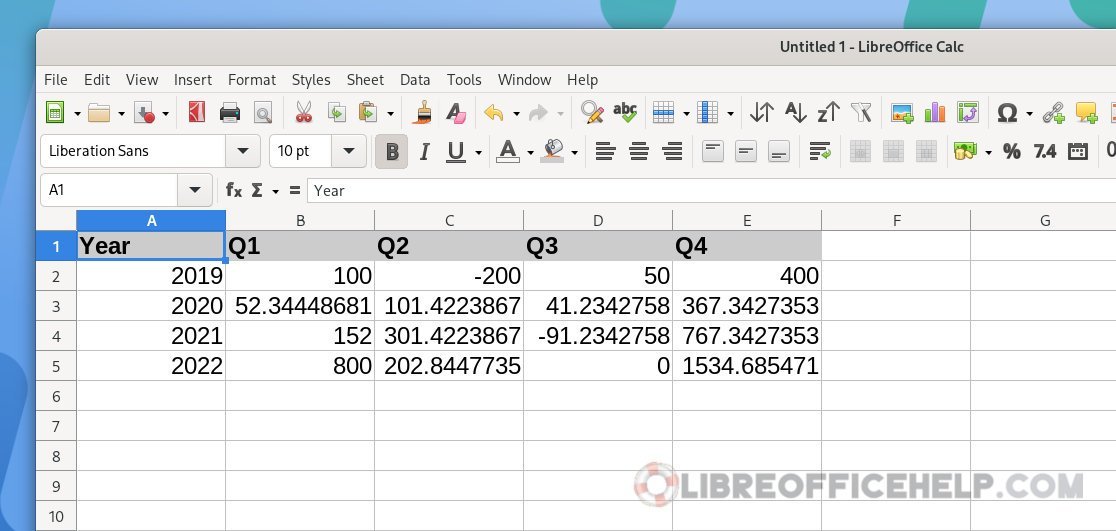
Let’s start with a simple set of data.
In this data, I have some random numbers per year and quarter.
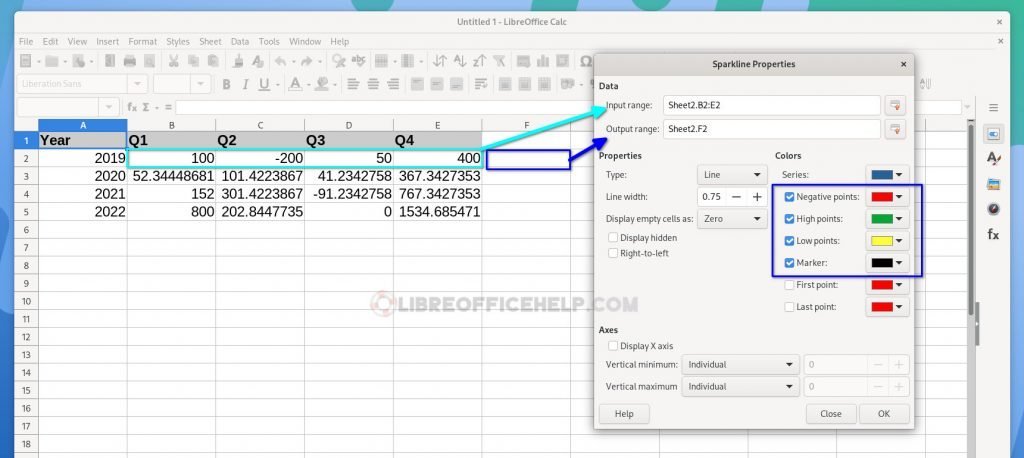
- Now, to add Sparklines from the menu, select
Insert > Insert Sparklines. - In the Sparkline properties window, select the
Input Rangefor your data. Here in this example, B2 to E2. - The
Output rangeis where the Sparklines will be created. You can choose any cell you want. - Next, select the
Typeof the lines. There are three self-explanatory types available:Line, Column and Stacked. - You can change the colours of various data types as well. Negative points are the values which are negative in the Input range. Similarly, high points, low points and marker colours can be selected.
- If you want, you can also change the first data and last data colour values.
For this example, I have selected the followings.
Once done, press OK.
And you should see the Sparklines in the target cell, i.e. F2.
You can repeat the same for all other rows or columns. Or you can create sparklines in a group range which I have explained here.

How to Change Sparkline Range again and colour values
What if you want to change the range or some colours or types of Sparklines? Yes, that’s also possible.
- To change the colours or types, select the Sparklines cell and choose
Insert > Insert Sparklinesfrom the menu.
- To change the range,
right-clickon the Sparklines cell and chooseSparklines > Edit Sparklines.
How to add Sparklines for a group or range of cells
Its time consuming to add Sparklines to each cell. So, you can easily follow the above steps to create Sparklines for multiple cells.
All you need to do is select the Input Range for the entire data set and the Output range where you want it to be.
Here’s a quick video to show you the Sparklines groups.
Similarly, if you want to edit/delete the ranges of the group, you can select Right Click > Edit Sparklines Groups or Delete Sparklines.

How to Delete
You can find the delete option in the right-click context menu, as shown in the above image.
Video
Here’s a quick view to demonstrate the above steps for your easy understanding.
Don’t forget to subscribe to our channel.
Wrapping Up
I hope this guide helps you to create beautiful Sparklines in LibreOffice Calc. Do let me know in the comment box below if it helps.

nice, it looks we’ve now an option to add a waterfall graphic 🙂